
The Best KPIs for Cross Functional Factory Visibility
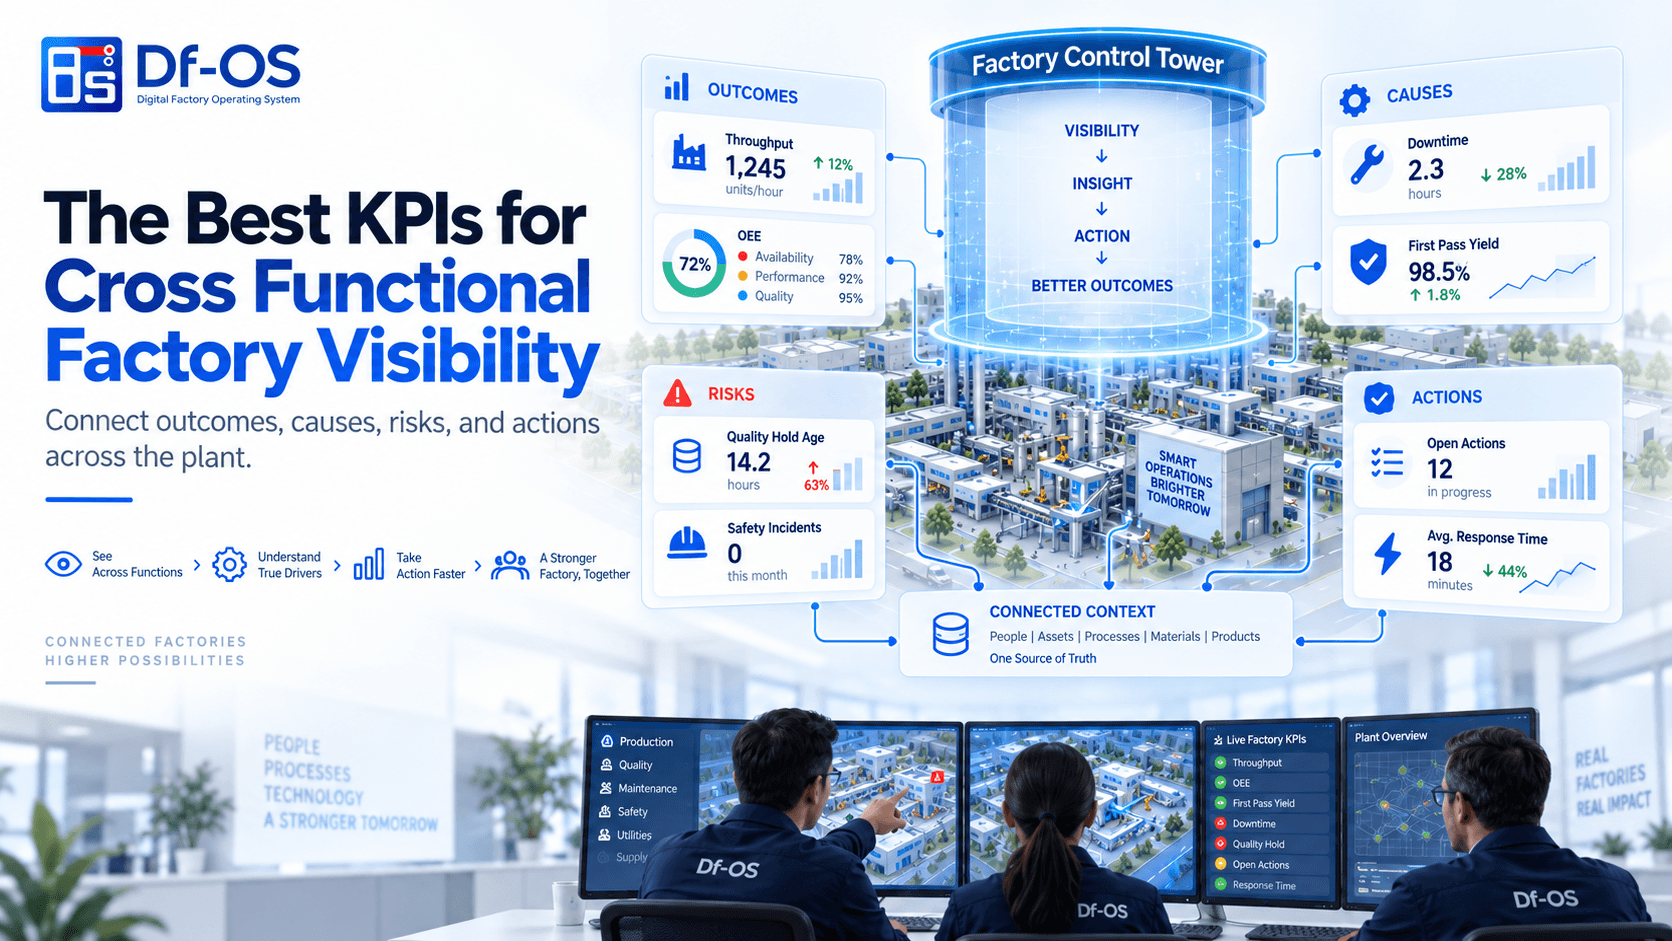
The best KPIs for cross functional factory visibility combine four levels: business and plant outcomes, operational causes, forward risks and action closure. Production, quality, maintenance, safety and utility metrics should be connected through common time, product, line and ownership context.
A factory does not need every metric on one screen.
It needs the few indicators that reveal outcome, cause, risk and action.
Cross-functional visibility fails when each department brings a different scorecard to the same review. Production focuses on output. Quality focuses on defects. Maintenance focuses on downtime. Utilities focuses on consumption. The plant manager must connect the story manually.
A Factory Control Tower should connect the measures through common time, line, product and ownership context.
The four level KPI stack
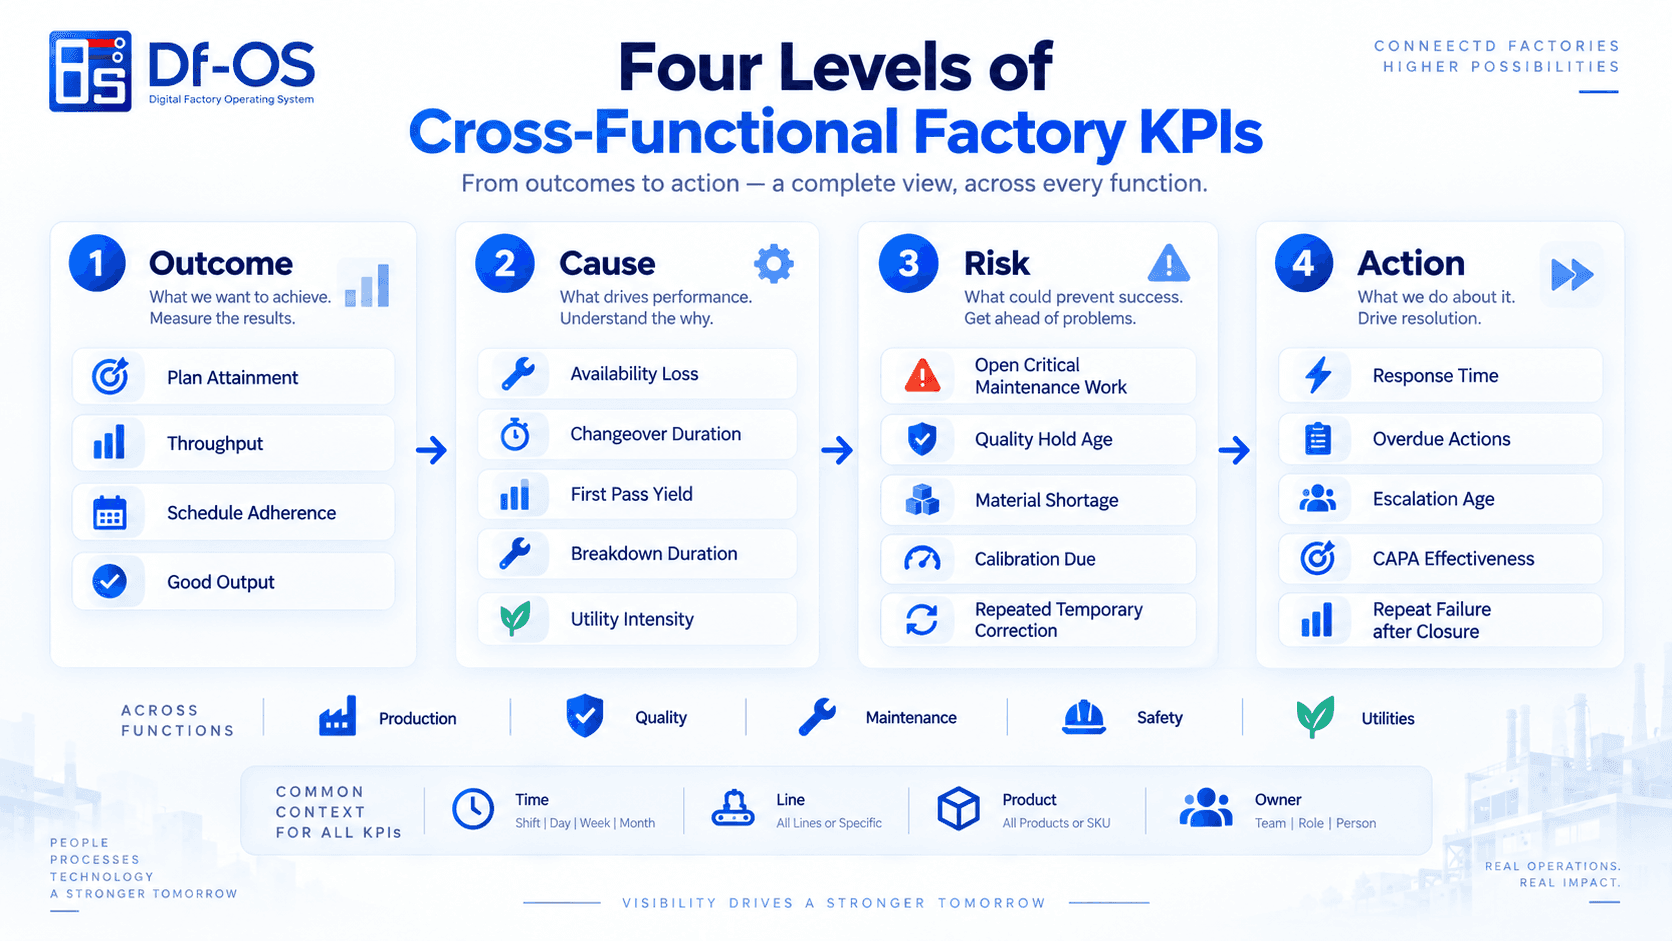
Level 1: Outcome
Outcome KPIs show whether the plant delivered its purpose.
Examples include:
- Plan attainment
- Throughput
- Schedule adherence
- Good output
- Conversion cost
- On time release
- Customer service impact
These are important, but they are late indicators. They show what happened.
Level 2: Cause
Cause KPIs explain the operating losses behind the outcome.
Examples include:
- Availability loss
- Performance loss
- Quality loss
- Changeover duration
- Micro stop frequency
- Breakdown duration
- First pass yield
- Rework
- Process deviation
- Utility intensity
These metrics help direct improvement.
Level 3: Risk
Risk KPIs show what may affect the next operating period.
Examples include:
- Open critical maintenance work
- Quality hold age
- Calibration due
- Material shortage
- Training or skill gap
- Permit status
- Abnormal condition trend
- Repeated temporary correction
- Supplier or batch risk
Risk indicators make the review forward looking.
Level 4: Action
Action KPIs show whether the organisation is responding.
Examples include:
- Response time
- Action closure
- Overdue actions
- Escalation age
- CAPA effectiveness
- Repeat failure after closure
- Decision lead time
- Open action by owner
This level is often missing from traditional dashboards.
Production KPIs
A useful production view may include:
- Plan versus actual
- Schedule adherence
- OEE with loss context
- Changeover performance
- Line speed loss
- Work in progress
- Shift variation
The metrics should link to specific events and owners.
Quality KPIs
Useful quality indicators include:
- First pass yield
- Defect rate
- Rework and scrap
- Deviation count and age
- Quality hold
- Inspection completion
- CAPA due and effectiveness
- Repeat deviation
A low defect rate can still hide a serious open quality risk. Current status matters alongside the final result.
Maintenance KPIs
Useful maintenance indicators include:
- Breakdown frequency
- Mean time to respond
- Mean time to repair
- Repeat failure
- Preventive maintenance compliance
- Critical backlog
- Spare availability
- Temporary repair age
The plant should distinguish maintenance loss from material, process and workflow causes.
Safety and compliance KPIs
Useful indicators include:
- Open high risk observations
- Permit compliance
- LOTO status
- Incident and near miss
- Corrective action closure
- Training and certification status
- Audit finding age
The view should protect confidentiality and role based access where required.
Utility and sustainability KPIs
Useful indicators include:
- Energy per good unit
- Water per batch or unit
- Compressed air loss
- Waste and yield
- Peak demand
- Abnormal consumption
- Resource cost by product or line
These metrics become more meaningful when connected to production context.
What makes a KPI useful
A KPI should have:
- Clear definition
- Named owner
- Reliable source
- Appropriate frequency
- Decision threshold
- Drill down to cause
- Action path
- Review cadence
A metric without a decision is often only information.
Avoid metric overload
A Control Tower should use role based views.
The operator needs immediate condition and action. The department head needs performance, risk and ownership. The plant manager needs cross-functional exceptions. The enterprise leader needs comparable outcomes and systemic issues.
Do not make every user navigate the same scorecard.
The role of Factory Metadata & Memory
Factory Metadata & Memory allows the user to move from a KPI to the operating events behind it.
A fall in first pass yield can be connected to:
- Product and batch
- Machine condition
- Material lot
- Shift
- Process deviation
- Corrective action
- Similar past history
This is what turns measurement into explanation.
How Vish AI can support KPI interpretation
Vish AI can help answer:
- Which losses explain today's plan gap?
- Which repeat events are driving downtime?
- Which open actions create the largest risk?
- Why did utility intensity rise on one product?
- Which plant shows a systemic quality pattern?
The answer should link to source records and should not replace responsible review.
A KPI rationalisation method
For each metric, ask:
- 1. Which decision does it support?
- 2. Who owns the decision?
- 3. How quickly must the information arrive?
- 4. Can the user see the cause?
- 5. Is there an action path?
- 6. Does another metric already serve the same purpose?
Remove metrics that do not support a clear decision or compliance need.
The Df-OS approach
Df-OS connects workflow and event data across functions. X-Konnect adds machine context. The Factory Control Tower provides role based visibility. Factory Metadata & Memory supports drill down and comparison. Vish AI can support interpretation.
Final perspective
The best factory KPI system does not maximise measurement. It improves decision quality.
Connect outcomes to causes, causes to risks and risks to action. That is the KPI structure a modern Factory Control Tower should provide.
Ready to Modernize Your Factory Operating Layer?
Discover how Df-OS digitizes shopfloor workflows, connects brownfield machines, and creates Factory Metadata & Memory without rip-and-replace disruption.
Frequently Asked Questions
There is no universal number. The main view should contain only the indicators required for the role's current decisions, with deeper detail available below.
Stay Ahead of Manufacturing AI
Join 15,000+ plant managers and industrial leaders receiving our bi-weekly reports on AI agents, shopfloor data operations, and the future of smart factories.
Df-OS Editorial Board
Industry experts mapping the future of connected digital factory operating systems and manufacturing intelligence.
Related Insights & Guides
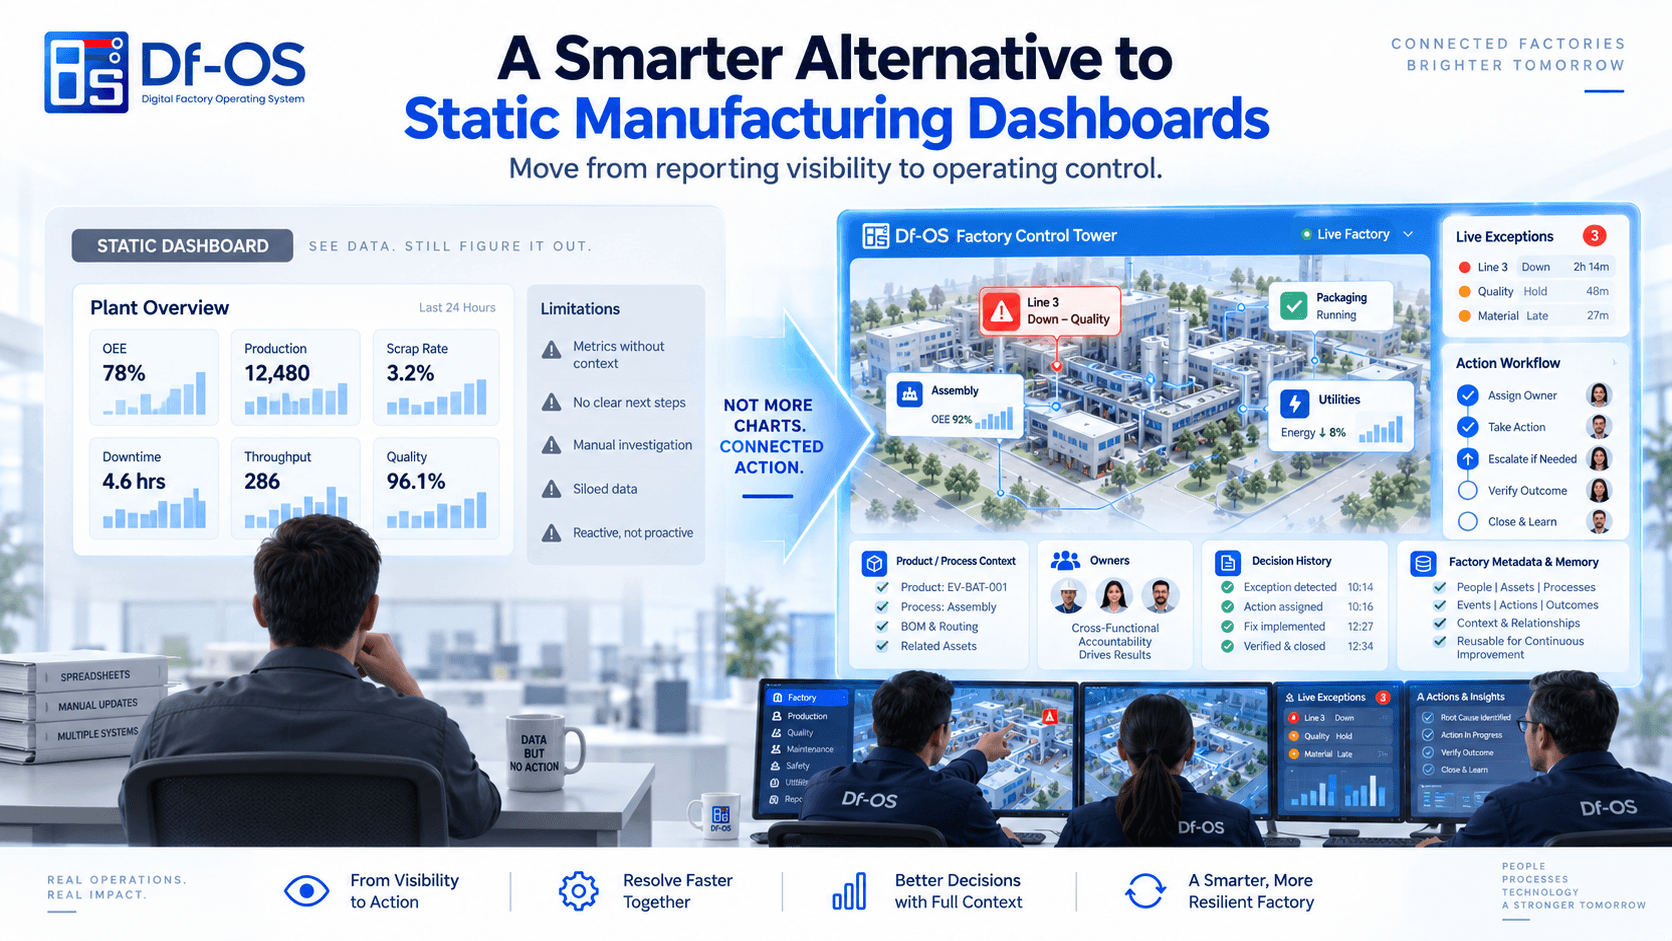
A Smarter Alternative to Static Manufacturing Dashboards
A comparison of static manufacturing dashboards and a connected Factory Control Tower that links metrics to live events, context, owners, workflows, escalation and verified closure.
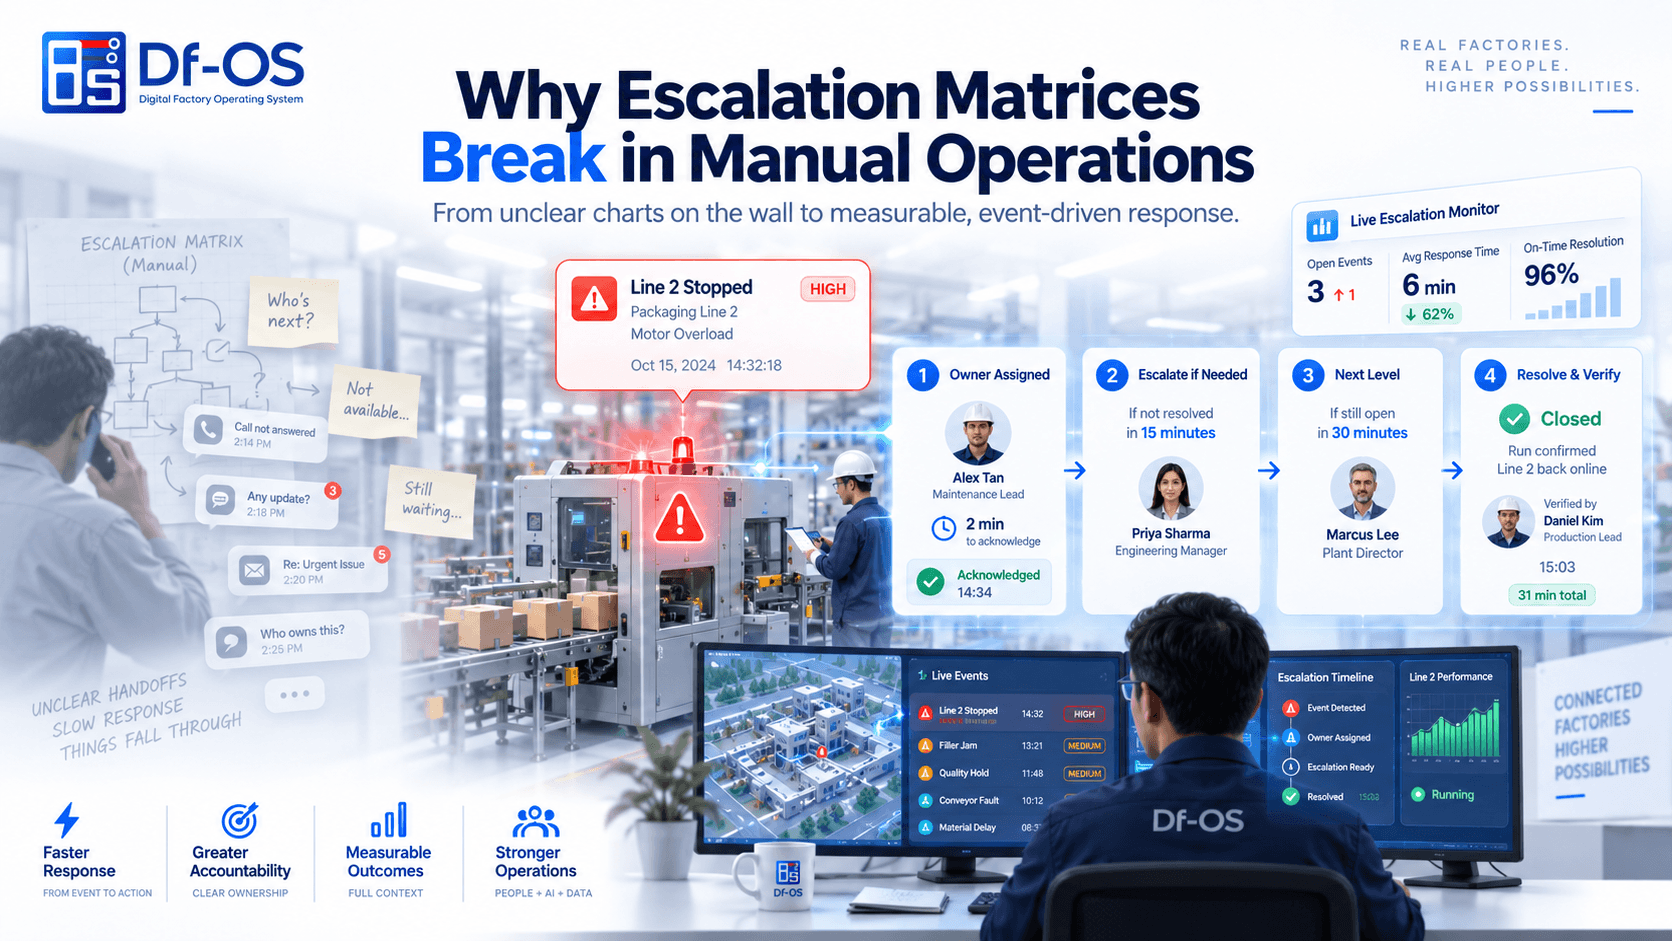
Why Escalation Matrices Break in Manual Operations
Why manual factory escalation matrices fail and how event-driven workflows connect measurable triggers, ownership, response time, escalation, closure evidence and learning.
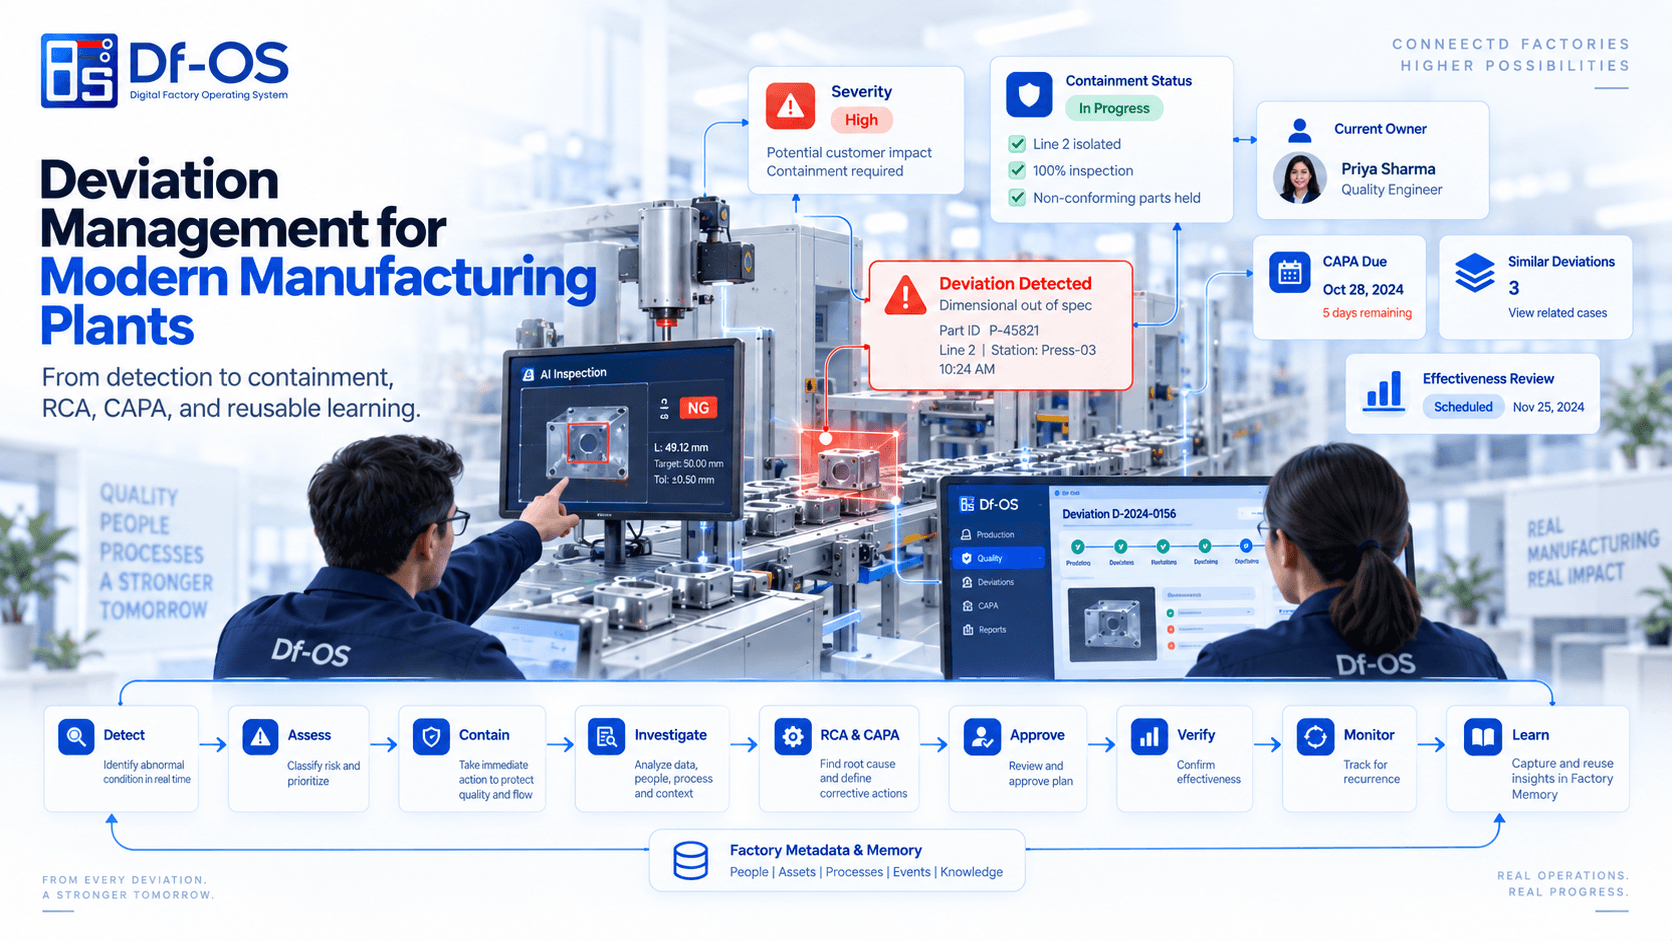
Deviation Management for Modern Manufacturing Plants
A connected manufacturing deviation lifecycle from detection and containment through RCA, CAPA, effectiveness review, recurrence monitoring and reusable operating memory.